Teaching students to graph polar equations often starts with “point-plotting,” but the AP Precalculus CED requires a more sophisticated understanding. Students need to see the graph not just as a static shape, but as a dynamic path where the distance from the pole is changing with respect to the angle. (You might want to read my old post How I Teach Polar Graphing.)
1. Beyond Point-Plotting: Mapping r as a Function of Theta
In Topic 3.14, students must understand how to utilize an auxiliary graph in rectangular form y=f(x) to help construction the polar graph of r=f(θ).
•The Strategy: Have students graph one period of the function (like y=2-4 sin(x)) on a standard (x, y) Cartesian plane first (image below).
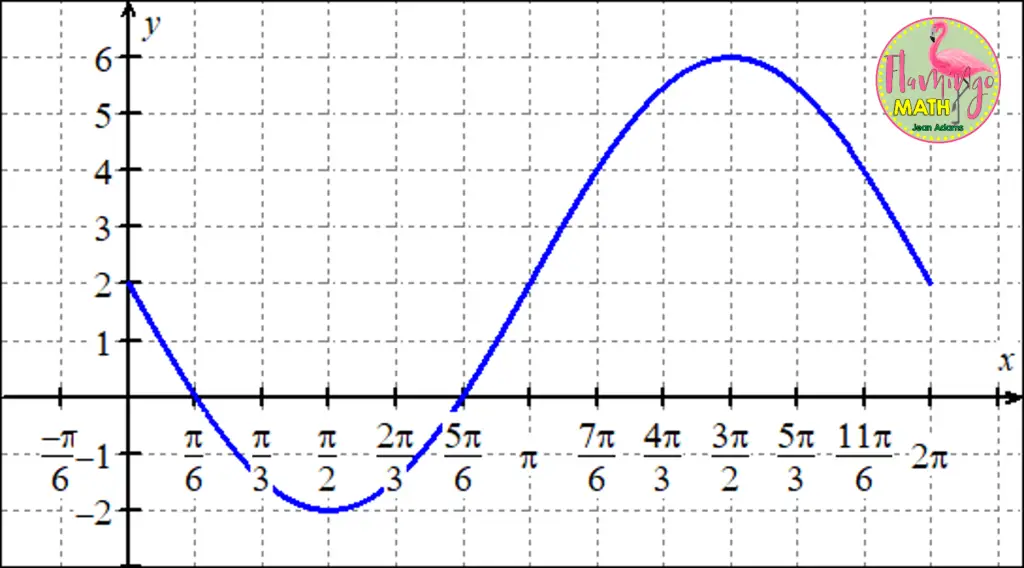
•The Connection: Use the rectangular graph to identify where y is increasing/decreasing and where y changes sign.
•Key Insight: If r is negative, the point is plotted in the opposite quadrant. This is a common “stumble point” for students that we can turn into a strength by analyzing the x-intercepts of our rectangular graph.
2. Analyzing Characteristics and Symmetry
AP Precalculus emphasizes the analytical properties of these curves. Your lessons should highlight:
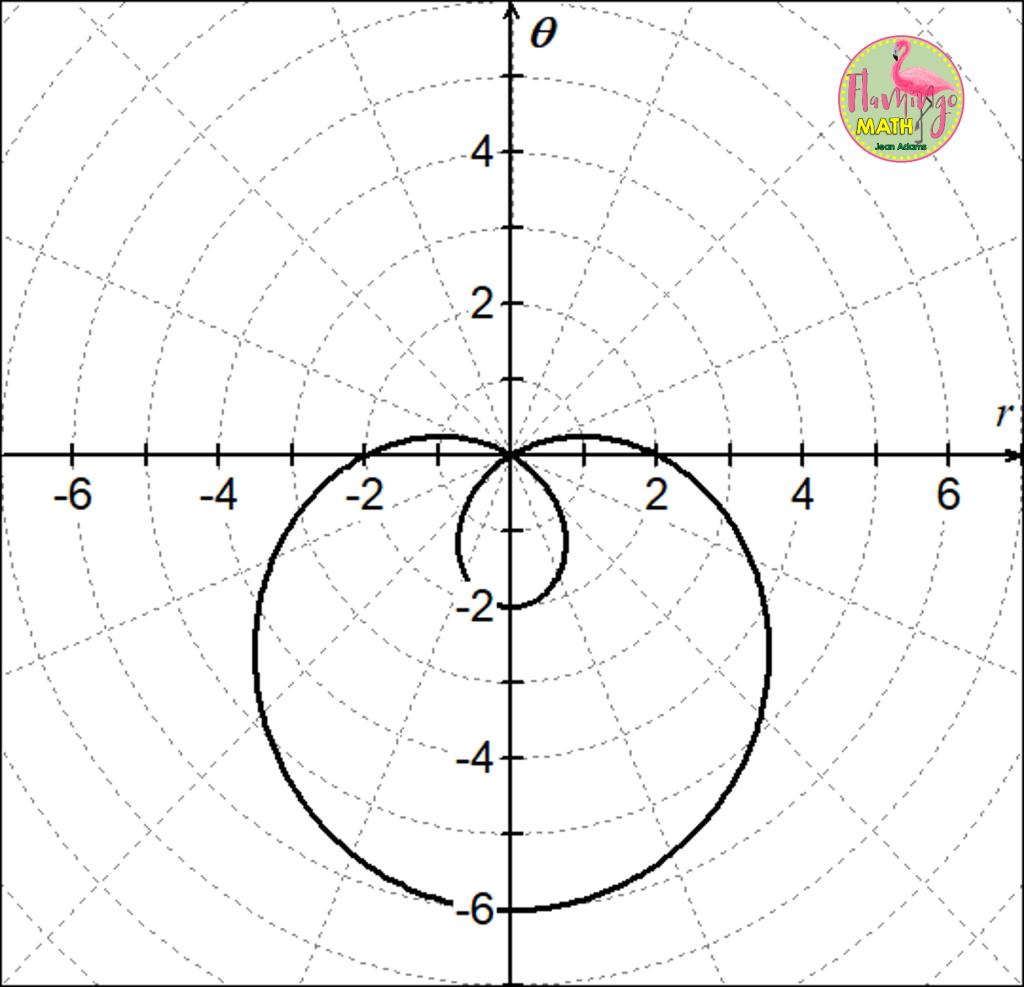
•Domain and Range: What is the maximum r-value (the “radius” of the curve)?
•Symmetry: Test for symmetry with respect to the polar axis (θ=0), the pole, and the vertical line θ=π/2
•Special Points: Finding the θ-values where the curve passes through the pole (r=0) is essential for determining the “petals” of rose curves or the inner loops of limaçons.
3. Rates of Change (Topic 3.15)
This is where the “Calculus-ready” part of Precalculus kicks in. Students need to describe the rate of change of r with respect to θ. When teaching this concept, it helps to break the analysis into two distinct layers.
•The Algebraic Sign of the Rate:
This first layer tells us what the radius is doing.
•A positive rate means the value of r is increasing and a negative rate means the value of r is decreasing.
•Direction of Motion is the Second Layer: Discuss how the curve is traced as θ increases. Does it move toward or away from the pole? Students should compare the sign of r with the sign of its rate of change.
•Moving Away From the Pole (same signs):
•If the rate is positive and the function is increasing ( + and +), the graph is moving further away from the
pole.
•If the rate is negative and the function is decreasing (- and -), the graph is moving further away from the
pole in the opposite direction.
•Moving Toward the Pole (opposite signs):
•If the rate is positive and function is decreasing (+ and -), the graph is moving toward the origin.
•If the rate is negative and the function is increasing (- and +), the graph is moving toward the origin from the negative side.
•The “Calculus Connection”: While students aren’t doing full derivatives yet, they are analyzing the behavior of that change. Use the rectangular graph from Topic 3.14 to find where the slope of r = f(θ) is positive or negative.
Classroom Tip: The “Zero” Threshold
I find it helpful to have students mark the x-intercepts on their rectangular y = f(x) graphs.
- Crossing the x-axis in the rectangular plane represents the curve passing through the pole on the polar curve.
- The behavior immediately before and after the intercept clearly shows the transition from “moving toward” to “moving away.”
4. Classroom Activity: The “Polar Walk”
To make Topic 3.15 concrete, have students “walk” a polar curve. [like r=2-4 sinθ].
- Place a pole (point) in the center of the room.
- As you rotate slowly (increasing θ), have a student move closer to or further from you based on a specific
equation. - Ask: “At θ=π/ 3, is your distance from me increasing or decreasing?” This builds the conceptual bridge to
the rate of change without getting bogged down in complex algebra.
5. Updated Vocabulary for the Digital Exam
With the transition to digital exams, students must be comfortable with the language of the CED. Ensure your materials use terms like:
•Extrema of r: Points furthest from the pole.
•Directed distance: Emphasizing that r can be negative.
•Periodic behavior: How the graph repeats over intervals of 2π (or π).
Take a look at the updated Guided Notes for the AP Precalculus Course
The AP Precalculus course and Polar Functions topics include specific Rates of Change practice problems that mirror the style of the AP Precalculus Progress Checks. These include analyzing r=f(θ) on a rectangular grid to predict polar behavior—exactly what students will see on the exam!