

Why Teach Polar Graphs?
Spring is right around the corner and many Precalculus teachers begin to stress about what content remains. If you are in that position, I would like to suggest that you cover the concepts for graphing polar equations.
The rationale…
Why is it important for Precalculus students to cover polar equations? Let’s consider the unit circle, as an example, . We know that this is not a function. In fact, many of our Precalculus students will finally begin to understand that this simple circle requires two separate functions to visualize the entire circle on a calculator.
and
. By teaching polar graphs, students learn they can write this equation using polar coordinates as r = 1, which also represents the unit circle. The best feature is that r = 1 names a function where
does not. Now, you might ask, “Why?” By some simple investigation students can see that for every choice of θ, there is only one corresponding value of r.
Since many problems in calculus require us to use functions, having this tool in our toolkit will be beneficial. We can represent rectangular relations (nonfunctions) using polar coordinates (functions). There is also a great opportunity here to show our students that the vertical line test for functions is only a valid test for equations in rectangular form.
The connection between two systems . . .
How can we help our students make a connection between the two systems?
I like to use a limaçon with an inner loop for my example. Let’s explore r = 2 + 4 cos θ. First, have students graph the equation y = 2 + 4 cos θ in the Cartesian plane. Notice that all we did was replace y for r. It’s great to get some discussion started here about amplitude, period, vertical shift of the y-axis, and where the function is negative. Students should be familiar with this line of questioning, and it will help build a sense of confidence for this new topic.
Since we have just learned about polar coordinates and translating between rectangular and polar form, we can talk about the earlier lesson where we found there were infinite representations of polar coordinates for any point in a polar coordinate system.
This will lead you to the need for a domain restriction in our example. Since we only want to consider one period of the curve in this case, our angles give 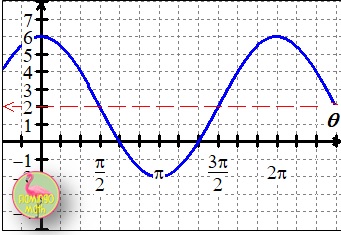 unique y-values from 0 to 2π. Once you know that students have analyzed and reviewed all of the essentials in the sinusoidal function . . . namely, amplitude 5, period 2π, vertical shift 2 units up, the sinusoid is negative from 120º to 240º. You are ready to move on to the next phase. I want my students to know how this graph will transfer to a polar curve and what will the polar graph look like.
You can have students work cooperatively as they create a table of values for this “auxiliary graph” using friendly angles. If they have access to a graphing calculator, you can have your groups calculate every 30 degrees and give decimal values. Don’t spend too much time with this.
The next line of questioning should naturally lead us to ask, “How can we use these values to sketch the polar graph?”
Students will have a table of (θ, y) that they can use to graph the polar curve(r, θ) . Be sure they notice where the values of r become negative. Ask students for conjectures about how these negative values on the “auxiliary curve” will affect the polar curve.
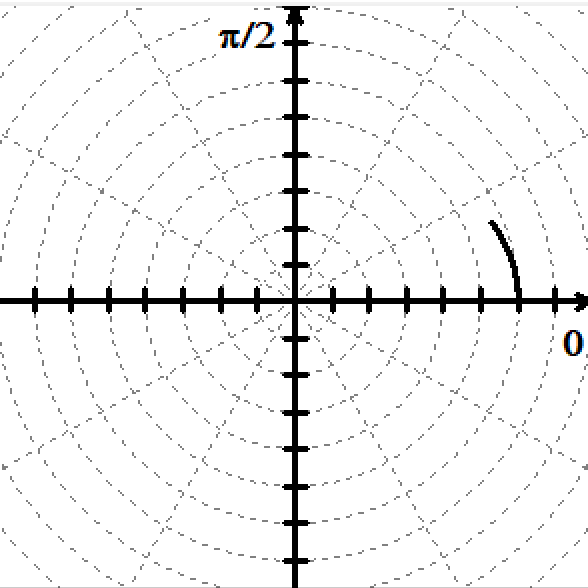
Graphing a polar curve using a rectangular reference graph . . .
Now, have students sketch the polar curve. Here is a page of polar graph paper for you to use.
When the limaçon is complete, be sure to reference the results of this behavior between 120º and 240º. Where the values for r become negative, the result is a small loop inside the larger outer loop. This shape is commonly called a limaçon with an inner loop. I’ve created an animation using my favorite free graphing tool WINPLOT to sketch and animate the curve. Then, I used the free Screen to GIF app to re-create the animation for my blog post. [NOTE: WINPLOT will animate easily for your classroom needs however, there is no way to upload those files to my blog.]
 Some final thoughts . . .
Will students be able to explain why the polar graph meets the conditions for a function on the domain from 0 to 2π? At this point in your discussion you will have a visual representation for why the vertical line test is only valid for the “auxiliary graph” in trigonometric form. However, the test will fail on the polar form of the function. Be sure they realize that both graphs represent functions and that they have the language to explain why! You should hear explanations that differentiate between the trig form graph passes the vertical line test; but, each value for theta, θ, has a unique value for r on the domain of one revolution on the limaçon with the inner loop.
If you need more practice for graphing polar curves and identifying the equation with the curve, or a complete lesson, be sure to check out these activities for your instructional needs.