 Each year my Pre-calculus students first encounter the graphs of sine and cosine curves, I find two groups of learners in my room. There are those who have completed the spaghetti graphing activity in Algebra 2 Honors, and then there are those that haven’t. This year I found a Geogebra Applet that helped everyone experience the activity using their laptop. I also found the spaghetti activity already created in paper and pencil format at NCTM Illuminations. It’s a great lesson for your Algebra 2 Honors students during the Introduction to Trigonometry Unit. You can download your copy HERE
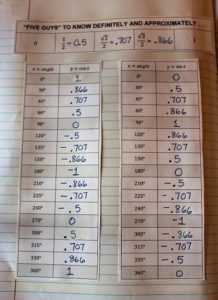
To begin graphing and translating graphs for Sine and Cosine functions this year, I had my students complete this page in their interactive notebooks. I want them to be familiar with both exact and decimal approximations of the “Five Guys” on the 16-point unit circle. Download your free copy: HERE There is also a bonus sheet of trigonometric graph papers.
Now, it’s just a matter of plotting the points for the Quadrantal angles starting at 0° and working around in a positive angle rotation to 360°. Both the sine function and the cosine function need 5-key points to complete one revolution. There is a starting point and a stopping point which divides the graph into four equal parts. The period of any sine or cosine function is 2π, dividing one complete revolution into quarters, simply the period/4.
Ask we are learning to graph the basic functions and simple transformations, I ask my students to repeat these patterns out loud, several times every day. I want them to learn the positive A-value patterns for the 5-key points of each function. Of course, we say max/min instead of the full word. Try it out, such a beautiful song to hear.
SINE where +A-value is: intercept-maximum-intercept-minimum-intercept
COSINE where +A-value is: maximum-intercept-minimum-intercept-maximum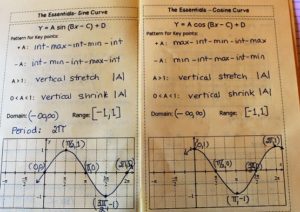
Now, for the real test. When it comes time to translate these functions with phase shifts, horizontal and vertical transformations, reflections, along with all four values A, B, C, and D in the standard form equation, I want my students to develop some procedural techniques for themselves to better understand how easy these graphs can be sketched. Patience and practice are the key.
I have my own personal procedural techniques that I model for my students prior to asking them to create their own step-by-step approach.
1) Identify the A,B,C, & D values
2) Write the pattern for either +A / –A based on the sine /cosine curves
3) Find the phase shift (this will be the first x-value to plot from your pattern)
4) Find the period
5) If you add the phase shift plus the period (which covers one cycle of the function) then you will know where your last x-value from your pattern will occur.)
6) Decide whether the x-axis has been translated by the D-value. If so, sketch that line and label it x- prime.
7) Plot your first and last pattern points, then equally space the remaining three points on this interval. I want my students to see that the order to plot the pattern points is FIRST POINT-LAST POINT-MIDDLE POINT-QUARTER MARK-THREE QUARTER MARK. We are simply cutting each division in half and then in half again.
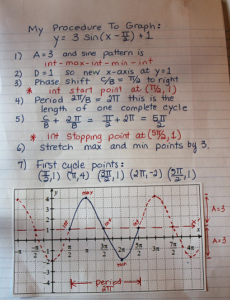 It’s so easy and orderly. Once they get the five key points plotted, the last thing to do is to connect the points with a smooth curve and then repeat the pattern if you want them to sketch two full periods of the function. Here’s the one we used this year to develop our own personal procedures.
Let me know what you think. Do you have any tips or tricks to graphing these sinusoidal curves?