Do you need some tips for helping your students LEARN HOW TO JUSTIFY GRAPH ANALYSIS PROMPTS … LIKE A ROCK STAR … ON THE AP EXAM ?
I often find that students get lost in the vocabulary and their ability to know which terms apply to a particular function. Several years ago, my colleague convinced me that his method was a pretty good anchor (chart) for beginners. After using his approach, I found my students were grasping the concepts faster. They began creating their own infographic to use, while working Free Response Questions, in cooperative groups.
At this time of year, with Spring Break coming to an end, many teachers begin to offer “AP Calculus® Review Boot Camps” to prepare for our special test day in May. If you are searching for material to help your students
prepare, I highly recommend spending a few days working through some of the graph analysis questions from old exams. Here are a few Free Response questions from the last few years you might like to use : 2017 #3; 2016 #3; 2015 #5; 2014 #3; 2013 #4; 2012 #3; 2011 #4; and 2010 #5
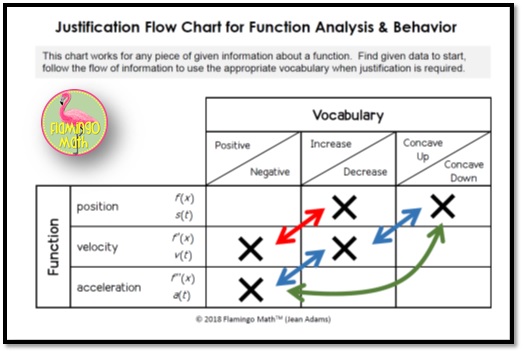
While I personally believe it is more meaningful for students to create this Justification Flow Chart for Function Analysis & Behavior, on their own, I’ve made a FREE COPY that you can print on card stock, then cut in half to give to your students.
Let me show you how it can be used in your classroom instruction.
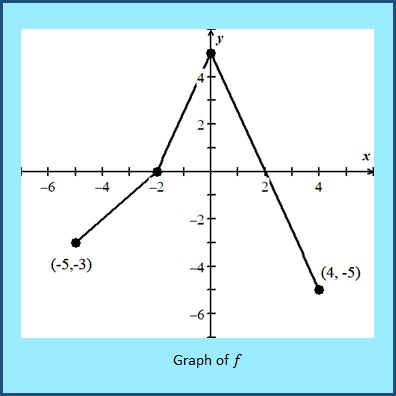
The (derivative) function f is defined on the closed interval [−5, 4]. The graph of f consists of three line segments and is shown in the figure at right. Let g be the function defined by
Let’s say we want to find the interval where the (position/antiderivative) function g(x) is increasing.
Notice that the function g(x) would be the position function, yet we are given the derivative, or velocity function.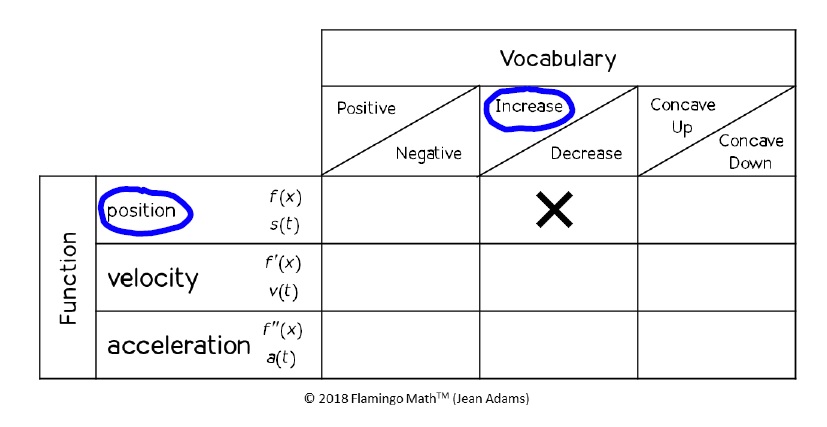 Starting with the end in mind, make some circles for the intended outcome we want, namely where the position is increasing.
Next, find a relationship with the given data. Notice that increase corresponds to positive on the derivative function. And there is a diagonal relationship between the position and derivative functions. In order for g(x) to increase, f(x) must be positive, implying y-values that are above the x-axis. This occurs on the interval from -2 <x < 2.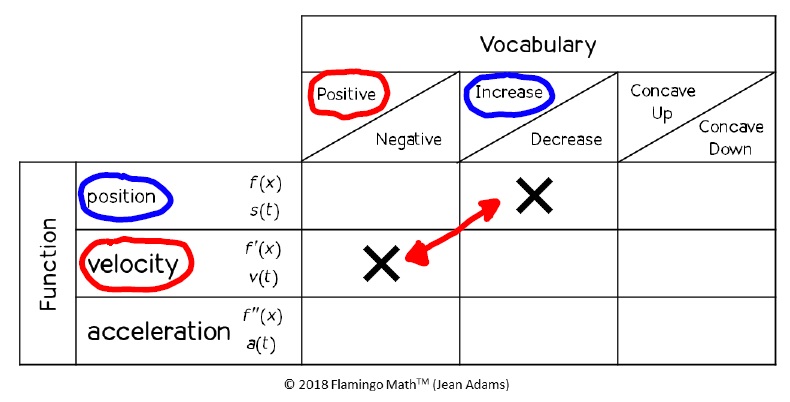
This diagonal relationship between the original function, the derivative function, and the second derivative function helps to create a great infographic for your students. Be sure to download a copy for yourself.
You and your students can also get a little practice using this infographic with these two Graph Analysis and Justification Practice pages I made especially for this blog post.
Hope you like them. Let me know if there is any topic that your students are struggling to master. I love having new ideas and challenges to write about.