Welcome to our Halloween Teacher Treats Blog Hop! My friend Doc Running is hosting the event to bring you some great food for thought as we head toward Halloween! At the bottom of my post be sure to hop over to the other math teacher sites and check out their tricks and treats for you!

I’m asked all the time how I get such great looking graphs for my card sorts, tests, task cards and Foldables®. So, let me tell you that I create them with WinPlot. I first learned about this program in 2000 from reading the AP Teacher Community website. It’s a free program with lots of great features. Let me share some of the essentials with you. It’s so easy!
 GRAPH BASICS IN WINPLOT
2. Unzip the program and open from the file in C:/Programs/peanut
3. Add a shortcut to your taskbar or desktop.
 4. Open the file, close the small daily reminder and expand
the window.
5. Click Window>2-dim
6. Next, Click Equation>Explicit. An inventory window
will open as y=f(x).
will open as y=f(x).
7. Let’s enter:


8. Now, adjust the graph window. Click View>View.
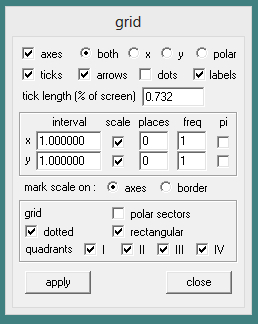
9. Then, Click View>Grid to add a dotted grid.

10. Since we will be sizing this in a Word document or a
PowerPoint file, it helps to make the font larger.
Click Settings>Axis Scale. Choose a larger font 14.
PowerPoint file, it helps to make the font larger.
Click Settings>Axis Scale. Choose a larger font 14.
11. In the same window, click Axis Labels
and enlarge these, also.
and enlarge these, also.
12. Still in the Settings Tab, let’s make the axis thicker
by clicking thickness and set the axis display pen width to 2.
by clicking thickness and set the axis display pen width to 2.
13. Your graph appears like this:

14. Next, click File and choose either:
Copy to Clipboard or
Copy to Clipboard or
Bitmap to Clipboard
15. Then paste your graph into a Word document or a PowerPoint file.
16. In Word, right click and Wrap Text>In Front of Text.
17. Finally, left click to select the graph, resize the image
to fit your needs.
to fit your needs.
18. If you like, you can also add a border around the
image with a right click, choose Format Picture,
then left click>Line>Solid.
image with a right click, choose Format Picture,
then left click>Line>Solid.
There is so much more you can do with this software. I have found many tricks and treats including drawing slope fields, piecewise functions, inequalities, and so much more.
” />